In high-temperature industrial processes, moisture readings are rarely straightforward. The same number can mean very different things depending on moisture range, process conditions, and installation effects.
At low moisture levels, small changes may signal a real process shift or just measurement noise. At higher moisture, readings can lag, flatten, or drift, masking what’s actually happening in the oven, stack, or duct. Heat, particulates, and mounting conditions only increase the uncertainty.
For operators and process engineers, the challenge isn’t getting a reading; it’s knowing whether to trust it. Misinterpreting moisture data leads to over-drying, unstable control loops, wasted energy, and measurements that are difficult to defend during audits or investigations.
This article explains how industrial moisture meter readings behave across moisture ranges, how to validate them in real plant conditions, and how to act on the data with confidence.
Key Takeaways
Moisture meter readings behave differently at low vs high moisture levels, and interpretation errors are most common at the extremes.
Small changes at low moisture can indicate real process shifts or measurement noise; context and trend matter more than the number.
At higher moisture levels, readings can compress, lag, or drift, masking real process changes.
Heat, particulates, installation, and sensor limitations often distort readings before they visibly fail.
The real risk isn’t missing moisture; it’s acting on a number that doesn’t represent actual process conditions.
How Moisture Meter Readings Change Across Moisture Levels
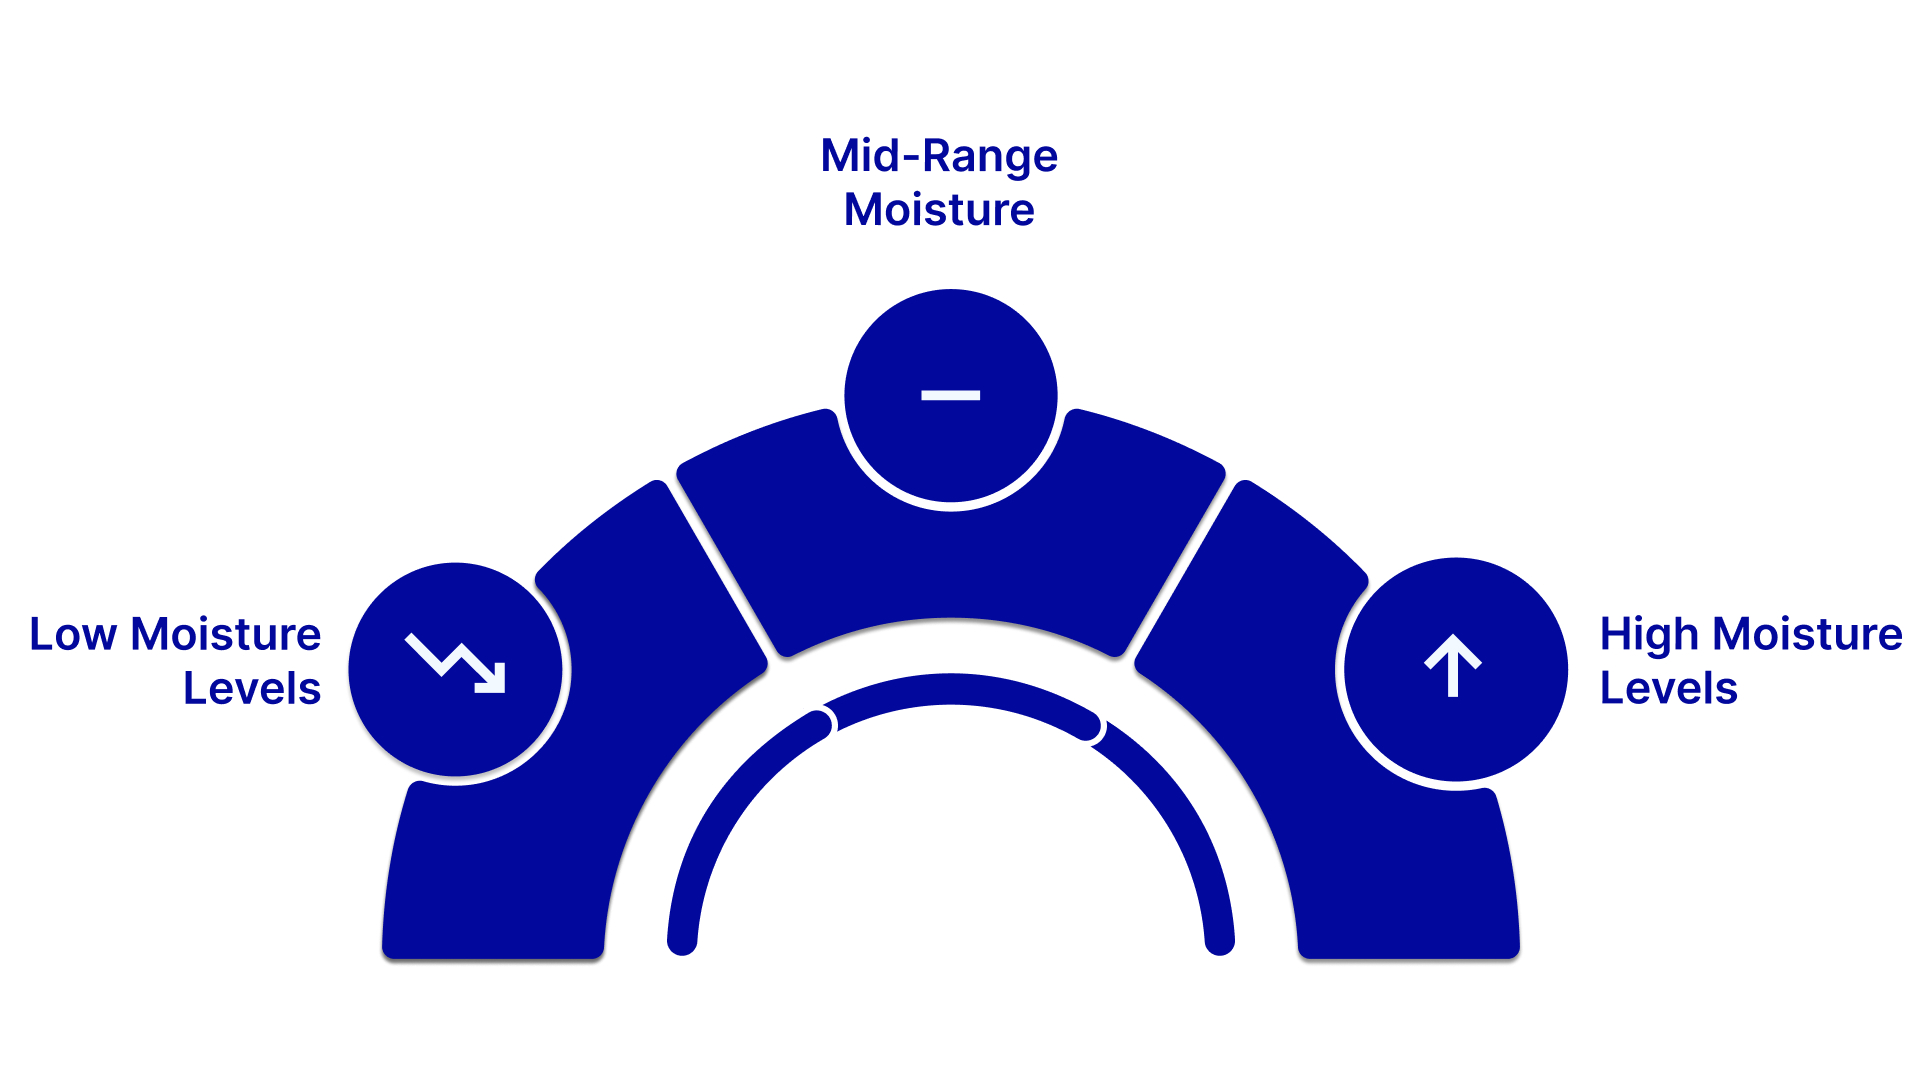
Moisture meter readings are not linear in their behavior or in how they should be interpreted. The same numerical change can mean very different things depending on where you are in the moisture range and what the process conditions look like.
Low Moisture Levels
At low moisture levels, readings tend to be highly sensitive. Small fluctuations may appear significant on a trend, even when the process itself hasn’t meaningfully changed.
Common challenges at the dry end include:
Signal noise becoming visible as “real” variation
Heat effects can overshadow actual moisture changes when sensors are not designed for high-temperature, in-situ measurement.
Installation or flow profile effects outweigh actual moisture changes.
Reacting to measurement noise as if it were process variation can lead to unnecessary control adjustments, destabilized loops, and wasted maintenance effort. Chasing small deviations at low moisture can lead to unnecessary control adjustments, tighter limits that destabilize the process, or excessive maintenance interventions. In many cases, the reading is technically correct, but operationally insignificant.
What matters most at low moisture isn’t the instantaneous value, but:
Repeatability over time
Correlation with other process variables
Whether changes persist beyond normal noise bands
Mid-Range Moisture
In the mid-range, moisture meter readings tend to be the most intuitive and actionable. Changes usually track process behavior more clearly, and trends are easier to interpret.
This is where moisture data often provides:
Reliable feedback for control loops
Clear indication of process drift
Better agreement with downstream effects (yield, energy use, emissions)
Even here, issues can arise if:
Sensors begin to foul slowly
Temperature compensation drifts over time
Installation conditions change after maintenance or outages
Stable-looking data doesn’t always mean healthy measurement. Gradual drift in the mid-range is often missed until it starts affecting product quality or energy consumption.
High Moisture Levels
At higher moisture levels, interpretation becomes more difficult again, but for different reasons. Readings may:
Compress, showing smaller changes than the process is actually experiencing
Lag behind real process shifts
Drift as sensors are exposed to condensation, contamination, or thermal stress.
In steam-rich or saturated industrial environments, fragile sensors can compress or lag, whereas rugged absolute moisture instruments maintain trend fidelity critical for energy and emissions decisions.
If this sounds familiar, the limitation may be the measurement approach itself. MAC Instruments builds in-situ moisture analyzers that measure absolute moisture directly in harsh industrial environments, without fragile optics, RH inference, or lab assumptions. For control, energy, or emissions use, a measurement approach designed for continuous high-temperature operation reduces interpretation effort and long-term risk.
Common Failure Patterns That Distort Moisture Meter Readings
In real plants, many measurement challenges start as subtle drift or loss of sensitivity, especially in technologies not engineered for harsh continuous operation. The instrument continues to output values, but the relationship between the reading and actual process moisture degrades. These failure modes are typically progressive and are often detected only after process or reporting problems appear.
Gradual Drift
Gradual drift, often seen in sensors not built for continuous, high-temperature environments, can shift reported moisture over time without a corresponding process change.
Typical contributors include:
Sensor surface fouling or coating
Long-term exposure to elevated temperatures
Aging of sensing or compensation elements
Operational impact:
Control setpoints shift without awareness
Energy usage increases as drying margins widen
Historical data becomes difficult to justify during audits
Drift is rarely detected by alarms because the rate of change is small relative to configured limits.
Loss of Sensitivity (Apparent Stability)
Loss of sensitivity occurs when the measurement output changes less than the actual moisture in the process.
Contributing factors:
Contamination-reducing sensor response
Saturation effects at higher moisture levels
Signal filtering, suppressing real variation
Operational impact:
Process excursions are underreported
Moisture variability is underestimated
Control actions lag real conditions
Flat or low-variance trends should not be assumed to indicate stable moisture without supporting process correlation.
Response Lag
Response lag occurs when the measurement output trails actual changes in process moisture.
Common causes:
Sensor placement far from the point of moisture change
Thermal mass delays the
sensor equilibrium
Boundary layer or condensation effects in steam-rich flows
Operational impact:
Delayed control response
Increased overshoot and oscillation in control loops
Reduced ability to correct transient events
Lag is most visible during startups, load changes, and process upsets.
Low-Moisture Signal Degradation
At low moisture levels, the signal-to-noise ratio of many measurement technologies decreases.
Typical contributors:
Temperature fluctuations dominate the signal
Flow-induced variability at the sensor
Electrical noise relative to small moisture changes
Operational impact:
Increased apparent variability
Difficulty distinguishing noise from real process change
Over-adjustment of controls
Low-moisture interpretation requires trend evaluation and correlation with other process variables.
Also Read: Applications for Industrial Moisture Analyzers
How to Validate Moisture Meter Readings Before Acting on Them
Before using a moisture meter reading for control adjustments, troubleshooting, or reporting, the reading should be evaluated for consistency with the process and with known measurement limitations. Validation does not require lab testing; it relies on cross-checks and trend behavior.
Check Trend Consistency Over Time
Single readings are rarely meaningful on their own. Validation starts with reviewing how the measurement behaves over time.
Indicators of credible data:
Changes align with known process events (load changes, temperature shifts, startup/shutdown)
Direction and rate of change are consistent with process physics
Variability remains within expected bounds for the operating range
Indicators of questionable data:
Step changes without a process trigger
Gradual monotonic drift during steady operation
Variability that increases without corresponding process instability
Correlate Moisture Readings With Related Process Variables
Moisture does not change independently. Valid readings typically correlate with other measured variables.
Useful correlations include:
Gas or product temperature
Fuel or steam input
Flow rate or residence time
Product moisture, yield, or downstream quality metrics
Lack of correlation does not automatically indicate sensor failure, but it should prompt closer review before corrective action.
Evaluate Behavior Across Operating Ranges
Validation should consider how the measurement behaves at low, mid, and high moisture levels.
Key checks:
Increased noise at low moisture is expected; step changes are not
Compression or reduced sensitivity at high moisture should be recognized
Transition behavior between ranges should be smooth, not discontinuous
Inconsistent behavior across ranges often indicates sensor limitations rather than process change.
Use Process Events as Natural Verification Points
Planned or unavoidable process events provide opportunities to verify measurement response.
Examples:
Startup and shutdown
Load changes
Intentional setpoint adjustments
Maintenance outages
A moisture measurement that does not respond appropriately during these events should not be relied upon for fine control or reporting.
Understand What Calibration Does and Does Not Resolve
Calibration can correct offset and slope errors under controlled conditions. It does not:
Remove fouling effects between calibrations
Improve response time
Eliminate installation-related biases
If readings change materially immediately after calibration, the issue is likely measurement degradation rather than process variation.
Using Moisture Meter Readings in Control, Energy, and Compliance Decisions
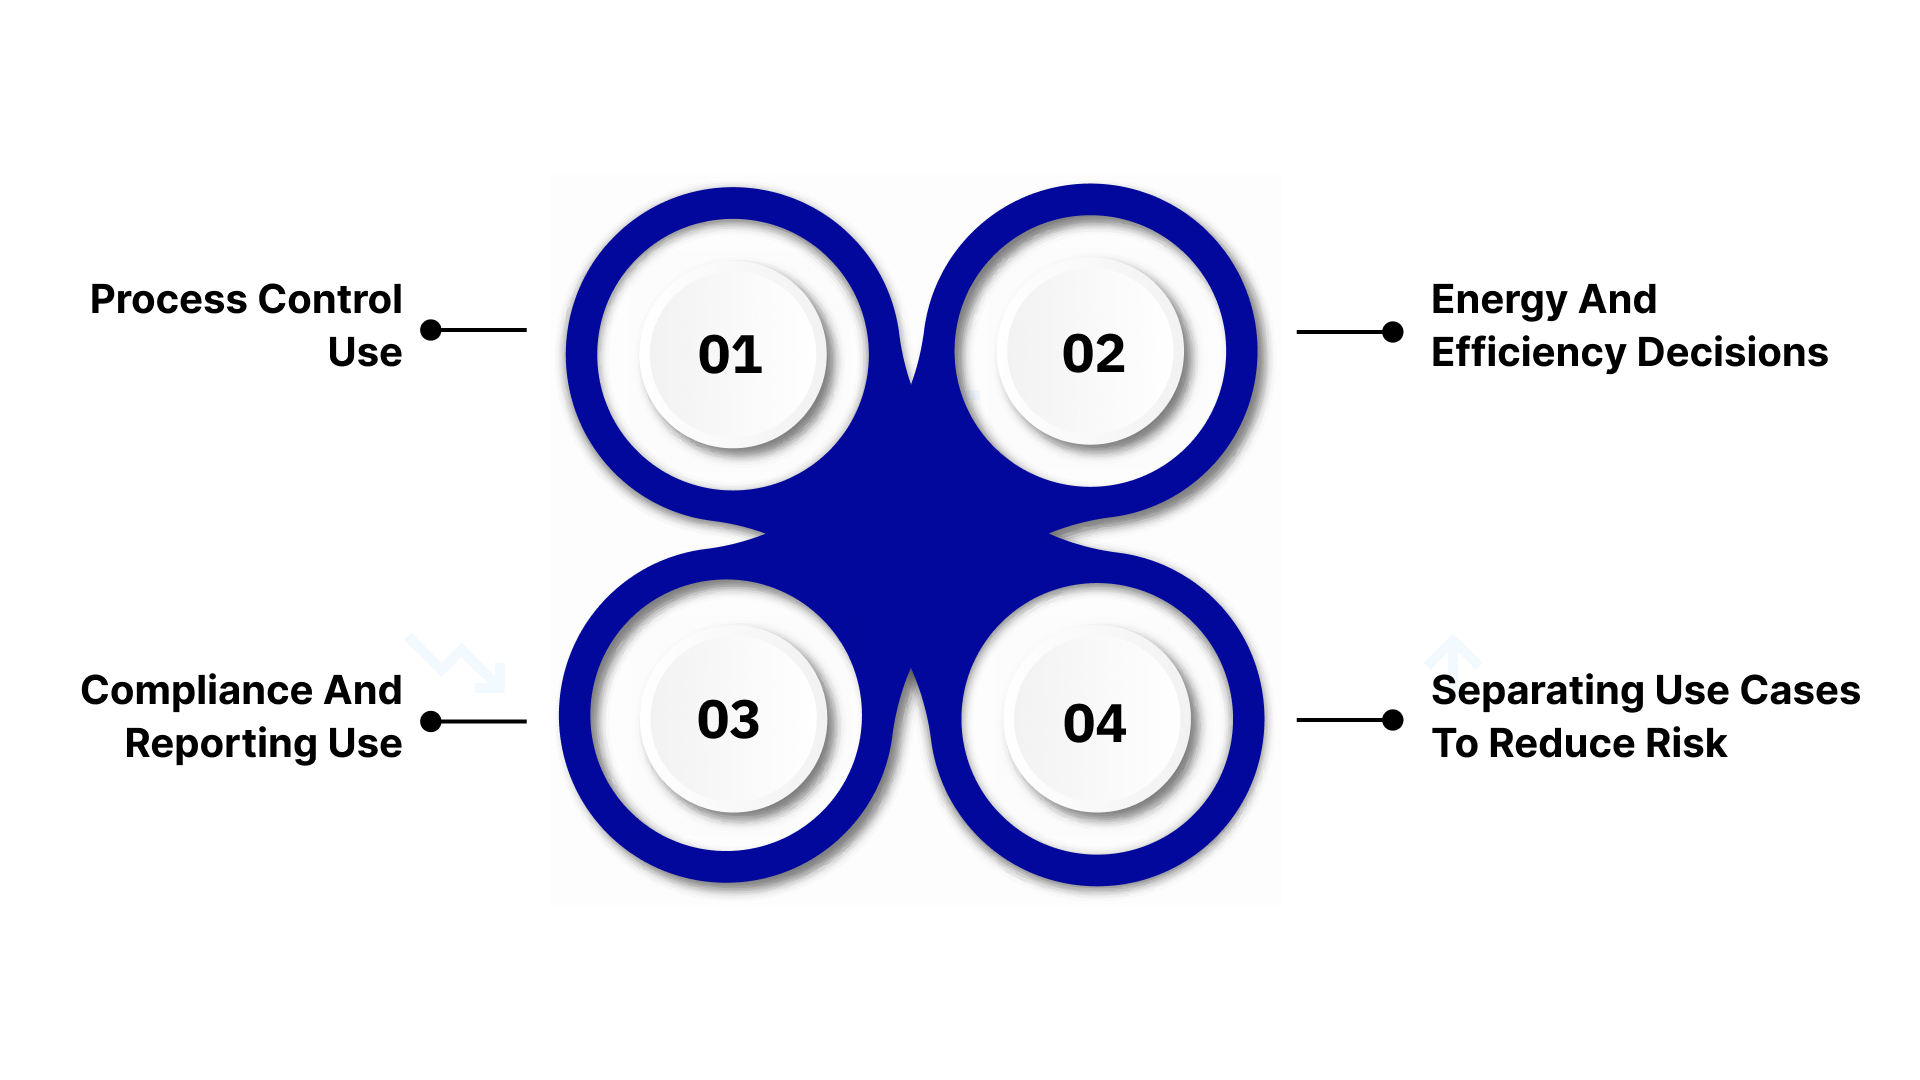
Once moisture meter readings are validated, their usefulness depends on how they are applied. In most plants, the same measurement is expected to support process control, energy decisions, and compliance reporting. Each use case places different demands on the data, and problems arise when those differences are ignored.
Process Control Use
In control applications, moisture readings are most effective as indicators of direction and stability rather than absolute truth. Interpretation has to reflect how the measurement behaves at the operating moisture level.
At low moisture, apparent variability often reflects measurement sensitivity rather than real process change. At higher moisture, lag or reduced sensitivity can delay corrective action.
In practice, control loops struggle when measurement characteristics — especially noise and lag from fragile sensing technologies- are tighter than the process supports. Rugged measurement that maintains stability reduces false alarms and loop hunting.
Stable control comes from aligning control logic with known measurement characteristics, not from forcing precision that the process environment doesn’t allow.
Energy and Efficiency Decisions
Moisture readings are commonly used to justify fuel, air, or steam adjustments in dryers, ovens, and kilns. Over time, even modest measurement drift can push operations toward conservative drying margins.
The result is higher energy consumption with no obvious trigger, because the change happens gradually and appears operationally reasonable.
At the opposite end, loss of sensitivity at higher moisture levels can mask inefficiencies until downstream quality or throughput problems emerge.
For energy decisions, moisture data should be reviewed periodically against fuel usage, steam consumption, and production results to confirm that the reading still represents actual process behavior.
Compliance and Reporting Use
When moisture readings are used for emissions or regulatory reporting, the tolerance for uncertainty changes. Repeatability and long-term stability matter more than short-term responsiveness. Data must remain explainable across reporting periods, audits, and personnel changes.
Issues arise when:
Long-term trends shift without a documented process cause
Calibration effects cannot be reconciled with historical data
Gaps or step changes appear in logged values
A moisture reading that is acceptable for control can still be difficult to defend in an audit if its behavior over time cannot be clearly explained.
Separating Use Cases to Reduce Risk
Risk increases when a single moisture signal is treated identically for all purposes. A common mitigation is to apply different filtering, averaging, or acceptance criteria depending on whether the data is being used for control, optimization, or reporting. Just as important is periodically reassessing whether the measurement still fits its role as process conditions, maintenance practices, or regulatory expectations change.
Moisture Meter Readings: Failure Mode Reference Table
This table summarizes how moisture meter readings commonly degrade in industrial environments, how those issues show up in the data, and what they usually indicate in practice.
Observed Behavior in Readings | Likely Underlying Cause | What It Means Operationally | Recommended Response |
|---|---|---|---|
Gradual upward or downward drift over weeks | Sensor fouling, coating, or long-term thermal exposure | The reported moisture no longer represents actual process conditions | Inspect sensor condition; verify calibration response; review trend against energy or quality metrics |
Flat or low-variance trend despite changing process conditions | Loss of sensitivity due to contamination, saturation, or filtering | Moisture changes are being underreported | Check response during known process events; review filtering and installation effects. |
Step change without corresponding process event | Electrical disturbance, recalibration effect, or sensor disturbance | Data discontinuity that may invalidate historical comparisons | Flag and document event; correlate with maintenance or configuration changes |
Lagged response during startups or load changes | Sensor placement, thermal mass, boundary layer effects | Control actions will be delayed or overshoot | Adjust control expectations; evaluate sensor location and response time |
Increased variability at low moisture levels | Temperature effects, flow turbulence, and low signal-to-noise ratio | Apparent instability may not reflect real process change | Widen control deadbands; rely on trend persistence rather than instantaneous values |
Readings appear reasonable, but downstream results degrade | Measurement drift or bias compensation in the control logic | Process is being miscontrolled without obvious alarms | Cross-check against product moisture, yield, or energy usage |
How to use this table:
If a moisture meter continues to output plausible values but process outcomes degrade, start with the observed reading behavior and work across the row before assuming a process fault.
Conclusion
Moisture readings become hard to trust, not because moisture is complex, but because measurement behavior shifts across moisture ranges and real plant conditions. At low levels, noise and sensitivity limits dominate. At high levels, readings lag, compress, or drift. In the middle, values can look stable while quietly losing their link to the actual process.
Reliable use of moisture data means recognizing these behaviors early, validating readings against process reality, and setting different expectations for control, energy optimization, and compliance. The aim isn’t perfect accuracy; it’s data that is consistent, explainable, and defensible.
MAC Instruments addresses this with rugged, application-specific analyzers like the MAC125 (direct %MV measurement in ovens up to 1200°F) and the MAC155 (built-in NIST-traceable calibration for emissions). By removing RH ambiguity and simplifying validation, these systems support real-time control and reduce energy waste with confidence.
Request a quote today.
Frequently Asked Questions
How should moisture meter readings be interpreted at very low moisture levels?
At low moisture, small numerical changes can reflect noise, temperature effects, or flow variability rather than real process change. Interpretation should rely on trend persistence and correlation with other variables, not instantaneous values.
Why do moisture meter readings flatten or lag at higher moisture levels?
At higher moisture, many measurement technologies lose sensitivity or respond more slowly due to sensor limitations, condensation effects, or thermal mass. The reading may remain stable while actual moisture changes.
How can you tell whether a reading reflects process change or sensor behavior?
Validation involves checking responses during known process events, correlating with related variables, and reviewing long-term trends for unexplained drift or step changes.
Are moisture meter readings reliable enough for control and compliance at the same time?
They can be, but expectations differ. Control tolerates short-term variability; compliance requires long-term stability and traceability. Treating both the same increases risk.
How often should moisture measurements be reviewed or validated?
Review frequency should align with process risk, operating severity, and compliance requirements. Gradual degradation is more common than sudden failure, so periodic trend review is critical.
What causes moisture readings to remain “reasonable” while process performance degrades?
Slow drift, loss of sensitivity, or control bias can mask real conditions. Because values stay within expected ranges, the measurement is often trusted longer than it should be.