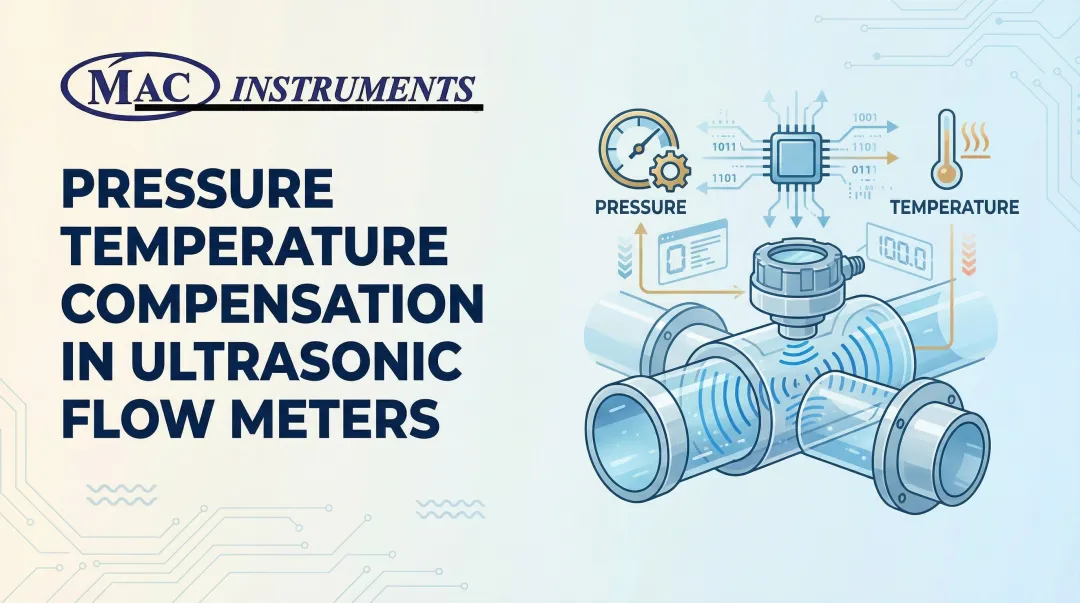
Introduction
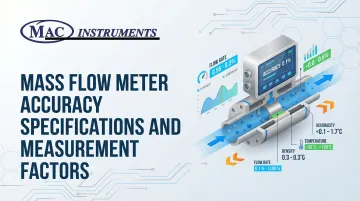
Accuracy stands as the single most critical performance specification that determines measurement reliability, process control quality, and operational costs in mass flow metering. Research shows that even a modest 3% measurement error in natural gas metering can cost facilities $2,466 annually in wasted fuel, making accuracy a direct financial concern.
Despite its importance, accuracy specifications remain widely misunderstood. Manufacturers express them differently—% full scale vs. % reading vs. % rate. Real-world performance often deviates from datasheet values, and environmental factors affect precision in ways that aren't immediately obvious.
This article clarifies what accuracy means in mass flow measurement and how to interpret specifications correctly for better purchasing decisions.
TLDR
- Meter accuracy shows how closely readings match actual flow, expressed as ±% of full scale, reading, or rate
- Total accuracy includes calibration uncertainty, repeatability, linearity, and stability
- Installation conditions, fluid properties, and environmental factors reduce real-world accuracy below lab specs
- Proper spec understanding prevents over-spending and improves process control
What Accuracy Represents in Mass Flow Meters
Accuracy measures the degree of conformity between a meter's displayed flow value and the true (reference) flow value. Manufacturers express this as maximum deviation—the largest error you can expect under specified conditions.
The International Vocabulary of Metrology (VIM) defines accuracy as "the closeness of the agreement between a measurement result and the true value." While qualitative in concept, you'll see it expressed quantitatively as measurement uncertainty.
Accuracy is not a single number. It's a composite specification influenced by calibration method, measurement principle, operating conditions, and time since calibration. Three distinct concepts often get confused:
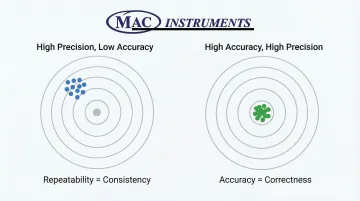
- Accuracy — Closeness to the true value (correctness)
- Precision (Repeatability) — Consistency of repeated measurements under identical conditions
- Resolution — Smallest detectable change the meter can register
A meter can be highly repeatable without being accurate—it might consistently read 5% high. Conversely, accuracy requires repeatability as a foundation; you cannot achieve high accuracy without high repeatability.
Understanding these distinctions helps you interpret manufacturer specifications correctly and set realistic performance expectations.
Design Specification vs. Operational Reality
Accuracy functions as both a design specification and an operational characteristic. Design specification reflects what the meter achieves under controlled laboratory conditions. Operational reality shows what it delivers in actual field use.
For example, a Coriolis meter might achieve ±0.05% of rate accuracy during factory calibration. Installation stress, temperature variations, and fluid property changes can degrade this performance in the field.
Why Accuracy Matters
Measurement accuracy directly impacts:
- Material balance calculations — Inaccurate flow data creates phantom losses or gains in inventory reconciliation
- Batch consistency — Reducing measurement error from 0.8% to 0.2% cuts component giveaway and increases yield
- Quality control — Precise flow control allows setpoints closer to specification limits in blending operations
- Regulatory compliance — Emissions monitoring and custody transfer require documented accuracy
- Raw material costs — Better accuracy reduces expensive ingredient waste
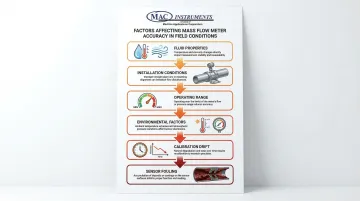
Factors That Influence Accuracy in Real-World Operation
Laboratory accuracy specifications represent ideal conditions that rarely exist in industrial installations. Understanding the gap between datasheet performance and field reality is essential for proper meter selection and realistic performance expectations.
Fluid Properties
The physical characteristics of your process fluid directly affect meter performance in several ways.
Density and Viscosity: Coriolis meters measure mass flow independently of fluid viscosity and density, making them ideal for applications with varying fluid properties.
Pressure drop across the meter increases with viscosity. Consider this during sizing to prevent flow restriction.
Temperature Effects: Temperature affects sensor behavior and electronics stability in measurable ways:
- Rheonik specifies additional uncertainty of ±0.002111% of maximum flow per °C if the meter isn't zeroed at operating conditions
- Emerson specifies process temperature effects of ±0.0002% to ±0.0006% of flow rate per °C depending on model
These values apply when operating outside calibration temperature ranges.
Installation Conditions
How and where you mount the meter significantly impacts measurement accuracy.
Straight Pipe Requirements: Despite claims of insensitivity to flow profile, TÜV SÜD recommends minimum 5 diameters (5D) of straight pipe upstream and downstream for Coriolis meters to minimize installation stress.
Valves located upstream should have at least 10D of straight pipe separation to avoid flow disturbances.
Mounting and Vibration: Firmly mount meters to prevent stress and vibration effects. Improper mounting introduces mechanical stress that affects sensor performance, particularly in Coriolis and thermal designs.
Electromagnetic Interference: Electronic flow meters require proper grounding and shielding to prevent EMI from affecting measurement signals and control electronics.
Operating Range Effects
Accuracy specifications typically apply to a specific flow range—often 10-100% of full scale. Performance degrades significantly outside this range.
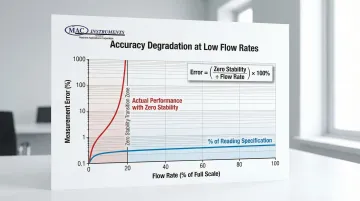
Low Flow Degradation: At low flows, zero point stability controls accuracy rather than percentage-of-rate specifications. As flow approaches zero, the fixed zero offset becomes a larger fraction of total flow. Accuracy degrades rapidly as a result.
Turndown Limitations: At high turndowns (>30:1), zero stability values govern measurement capability. The base accuracy specification no longer applies in these conditions.
Environmental Factors
Operating conditions surrounding the meter affect measurement reliability.
Pressure Effects: Pressure affects Coriolis tube stiffness, with uncertainty of ±0.00963% of maximum flow per bar if not corrected.
Pressure also affects density measurement, with effects of ±0.000015 g/cm³ per bar for certain models.
Ambient Temperature: Electronics housings have operating temperature limits. Extreme ambient temperatures affect signal processing and output stability.
Time and Wear
Meter performance changes over time due to physical and electronic aging.
Calibration Drift: All meters experience calibration drift over time from these sources:
- Sensor aging
- Electronic component drift
- Mechanical wear
The drift rate varies by meter technology and operating conditions.
Sensor Fouling: Coating or fouling of sensor surfaces changes thermal or mechanical properties, degrading accuracy. This is particularly problematic in thermal mass meters and Coriolis meters handling dirty fluids.
Mechanical Wear: Moving parts in turbine and positive displacement meters wear over time, increasing clearances and reducing measurement accuracy.
How Accuracy Is Specified, Measured, and Validated
Manufacturers use different methods to state accuracy, making direct comparisons difficult without understanding the underlying basis. The same meter can appear to have vastly different accuracy depending on how specifications are expressed.
Accuracy Expression Methods
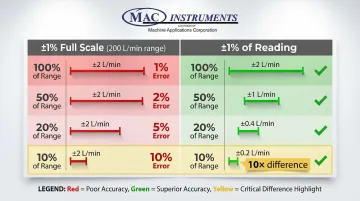
Percentage of Full Scale (% FS): Error is a fixed percentage of the maximum scale value, regardless of actual flow.
Example: A meter with ±1% FS accuracy and 0-200 L/min range has a constant ±2 L/min error. At 100 L/min flow, this represents 2% of reading. At 10% of full scale, this equals ±10% of the measured value—ten times worse than it appears.
Percentage of Reading (% RD): Error is a percentage of the actual measured value. The absolute error decreases proportionally as flow decreases.
Example: ±1% of reading at 100 L/min = ±1 L/min error. At 50 L/min, error drops to ±0.5 L/min.
Percentage of Rate (% Rate): Similar to % reading but specifically applied to the instantaneous flow rate. This is the most common specification for high-accuracy meters like Coriolis devices.
Zero Stability: For Coriolis meters at low flows, accuracy is expressed as: Accuracy = (zero stability ÷ flow rate) × 100%. This formula shows why accuracy degrades asymptotically as flow approaches zero.
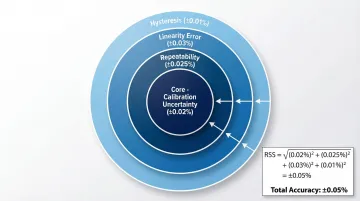
Components of Total Accuracy
Stated accuracy specifications combine several independent error sources. Understanding each component helps you evaluate real-world performance:
- Calibration uncertainty: Uncertainty of the reference standard used during calibration
- Repeatability: Variation in repeated measurements under identical conditions
- Linearity error: Deviation from ideal straight-line response across the flow range
- Hysteresis: Difference in reading when approaching a flow point from above vs. below
High-end Coriolis meters typically include all these components in their stated accuracy specification (e.g., "±0.05% of rate includes linearity, hysteresis, and repeatability").
Calibration and Traceability
Accurate specifications mean nothing without proper calibration. Here's how manufacturers ensure measurement reliability.
Calibration Methods: NIST and other national laboratories use primary static gravimetric liquid flow calibration systems as reference standards. Manufacturers then use ISO/IEC 17025 accredited calibration rigs to ensure measurement traceability to SI units.
NIST Traceability: Accredited calibration labs ensure measurement traceability through documented calibration chains that link back to national standards. This documented chain guarantees that your meter's accuracy claim has a verifiable foundation.
Field Verification: Portable flow rigs can calibrate instruments to within ±0.25% or better, though they're less accurate than laboratory systems. Field verification methods include mass balance checks and comparative measurements against reference meters.
Reading Manufacturer Datasheets
When reviewing specifications:
- Identify whether accuracy is stated as % FS, % reading, or % rate
- Check what operating conditions apply (flow range, temperature, pressure, fluid type)
- Determine what's included in the accuracy claim (linearity, repeatability, hysteresis)
- Look for separate specifications at different flow ranges
- Verify calibration conditions and traceability documentation
Range and Tolerance Specifications
Flow meter accuracy specifications remain valid only within defined operating conditions. Outside these boundaries—whether from extreme flow rates, temperature shifts, or fluid property changes—measurement errors multiply quickly.
Nominal Operating Range
Manufacturers express the valid operating range as a turndown ratio (maximum flow ÷ minimum flow):
- Thermal mass meters achieve up to 1000:1 turndown ratios, though practical accuracy limits narrow significantly at extremes
- Coriolis meters maintain 20:1 to 100:1 effective turndown before zero stability errors begin dominating measurements
- Magnetic meters: 10:1 to 20:1 typical turndown with maintained accuracy
These ratios assume specific fluid properties, temperature, and pressure conditions.
Tolerance Limits and Uncertainty Bands
Understanding how manufacturers define tolerance helps you interpret accuracy claims:
Confidence Intervals:
- Most specifications represent ±1σ limits (68% of readings fall within stated accuracy) or ±2σ limits (95% confidence)
- A ±1% accuracy rating at 2σ confidence means 95% of measurements fall within ±1% of true value
- Always verify which confidence level applies to your meter's specification
Uncertainty Accumulation:
- Total measurement uncertainty grows as you move toward range extremes
- Multiple error sources (temperature drift, signal noise, calibration uncertainty) combine at low or high flow rates
- Actual performance at 10% of full scale may exceed nominal specifications by 2-3×
Key Technical Properties of Accuracy
Several interconnected properties determine accuracy performance. Each behaves differently across operating conditions.
Repeatability and Stability
Repeatability: Short-term measurement consistency under identical conditions.
- Coriolis meters: 0.025% to 0.05% of rate
- Thermal meters: ±0.5% to ±2% of reading
- Magnetic meters: ±0.2% to ±0.5% of rate
Long-Term Stability: Accuracy drift over weeks or months due to sensor aging, fouling, and electronic drift.
High repeatability doesn't guarantee high accuracy—a meter can be consistently wrong.
Zero Stability: This specification is critical for low-flow accuracy. The Rheonik RHM02 has zero stability of 0.00009 kg/min.
The Micro Motion CMFS010M has zero stability of 0.002 kg/h.
Linearity and Rangeability
Linearity Error: Deviation from ideal straight-line response across the flow range. Some meters perform better at high flows, others at low flows.
Different meter technologies handle linearity differently:
- Thermal meters require curve-fit corrections to account for inherent non-linearity
- Coriolis meters typically include linearity in their stated accuracy specification
Rangeability: The flow range over which accuracy specifications hold. Below a certain threshold defined by zero stability, accuracy shifts from constant % of rate to a formula based on zero stability:
Formula: For flow Q < (Zero Stability ÷ Base Accuracy/100), Uncertainty = (Zero Stability ÷ Q) × 100
Response Time and Dynamic Accuracy
Response Time: How quickly meters respond to flow changes.
Fast response is critical for batch control and process upset detection.
Dynamic vs. Steady-State Accuracy: Most accuracy specifications apply to steady-state conditions.
Pulsating or rapidly changing flows can degrade accuracy significantly, particularly in thermal and turbine meters. Coriolis meters generally handle dynamic conditions better due to their measurement principle.
Implications of Operating Outside Specified Accuracy Range
Operating beyond specified limits doesn't immediately damage the meter, but it progressively degrades measurement quality. Understanding these degradation patterns helps process engineers anticipate control issues and compliance risks before they impact production.
Performance Degradation Mechanisms
As flow drops below the base accuracy range, errors grow exponentially due to fixed zero stability. At very low flows, measurement error can reach 10-20% even in high-accuracy meters. This non-linear error growth makes extrapolation unreliable.
Sensor signals become noisy and unstable at operating extremes, causing erratic readings and control loop instability. Temperature or pressure extremes affect sensor properties unpredictably, invalidating calibration data.
Process Control Impact
When measurement quality degrades, the effects cascade through process control systems:
- Noisy measurements cause excessive valve cycling and poor loop performance
- Inconsistent flow control creates process variability and product quality issues
- Inaccurate ingredient ratios produce batches outside specifications
- Operators add safety margins to compensate for uncertainty, increasing raw material consumption
Compliance and Safety Risks
Operating outside accuracy specifications creates regulatory and safety exposure:
Regulatory Compliance: EPA 40 CFR 98.444 requires NIST-traceable calibration for CO₂ emissions monitoring. Operating outside specified accuracy ranges voids compliance documentation. OIML R 117-1 mandates low-flow cut-offs be set no higher than 20% of minimum flow rate for custody transfer applications.
Warranty and Liability: Operating outside specified conditions typically voids manufacturer warranties, leaving facilities responsible for calibration and repair costs.
Safety Hazards: In critical applications like flare gas monitoring or toxic gas measurement, inaccurate readings can fail to detect dangerous conditions. This creates immediate safety risks for personnel and environmental hazards.
Common Misinterpretations of Accuracy Specifications
Treating Nominal Accuracy as Absolute Guarantee
"±1% accuracy" doesn't mean every reading falls within 1%—it's a statistical specification with confidence intervals. Some readings will fall outside the stated range, particularly at the extremes of operating conditions.
Confusing Accuracy with Repeatability
A meter can be highly repeatable (precise) but inaccurate (biased away from true value). Repeatability is necessary but not sufficient for accuracy.
Ignoring the Basis of Accuracy Statement
Understanding how accuracy is specified makes a critical difference at low flow rates. Consider this comparison:
±1% Full Scale (FS) vs. ±1% of Reading:
- Meter A (±1% FS, 0-200 L/min range): Error is always ±2 L/min. At 20 L/min flow, error is 10% of reading
- Meter B (±1% reading): At 20 L/min flow, error is ±0.2 L/min (1% of reading)
At low flows, Meter A has 10 times more error than Meter B despite both claiming "±1% accuracy."
Assuming Lab Accuracy Equals Field Accuracy
Installation effects, fluid property variations, and environmental conditions always degrade accuracy from datasheet values. Expect field accuracy to be 2-3 times worse than laboratory specifications unless installation is carefully controlled.
Conclusion
Accuracy determines measurement quality and directly impacts process performance and profitability. Understanding the three core accuracy dimensions ensures reliable operations:
- How accuracy is specified (% FS vs. % reading vs. % rate)
- What factors affect it (installation, fluid properties, operating range)
- How to maintain it over time (calibration, verification, proper operation)
The difference between stated accuracy and achieved accuracy often determines whether a flow measurement system delivers value or creates hidden costs through wasted materials, poor process control, and regulatory non-compliance.
Closing this gap requires engineering judgment alongside published specifications. Proper meter selection, careful installation following manufacturer guidelines, and regular maintenance including periodic calibration all contribute to achieving stated accuracy in real-world conditions.
The lowest-cost meter rarely delivers the best value when total cost of ownership includes accuracy-related losses.
Frequently Asked Questions
What is the accuracy of a mass flow meter?
Coriolis meters achieve ±0.05% to ±0.10% for liquids and ±0.25% to ±0.50% for gases. Thermal mass meters typically achieve ±1.7% to ±2%, while magnetic meters achieve ±0.5% for conductive liquids.
Which flow meter is most accurate?
Coriolis meters offer the highest accuracy (±0.05% or better), followed by ultrasonic and magnetic meters at ±0.5%. Thermal and turbine meters typically achieve ±1-2% accuracy.
How accurate is the Magflow meter?
Magnetic flow meters typically achieve ±0.5% accuracy for conductive liquids with minimum conductivity around 5 μS/cm. Accuracy depends on proper installation, adequate conductivity, and absence of entrained gas. Non-conductive fluids cannot be measured.
How do you calculate mass flow meter accuracy?
Total accuracy equals the square root of the sum of squares: √(Cal² + Rep² + Lin²), or conservatively, the arithmetic sum of all error sources. At low flows, Coriolis accuracy is: (Zero Stability ÷ Flow Rate) × 100%.
What factors affect mass flow meter accuracy over time?
Primary factors include sensor fouling or coating, calibration drift, mechanical wear, changes in fluid properties, and environmental conditions like vibration and EMI. Recommended recalibration intervals range from 6 months to 2 years depending on application criticality.
What is the difference between accuracy and repeatability in flow meters?
Accuracy measures closeness to the true value, while repeatability measures consistency of repeated measurements. A meter can be highly repeatable but inaccurate if systematically biased. High repeatability is necessary but not sufficient for high accuracy.